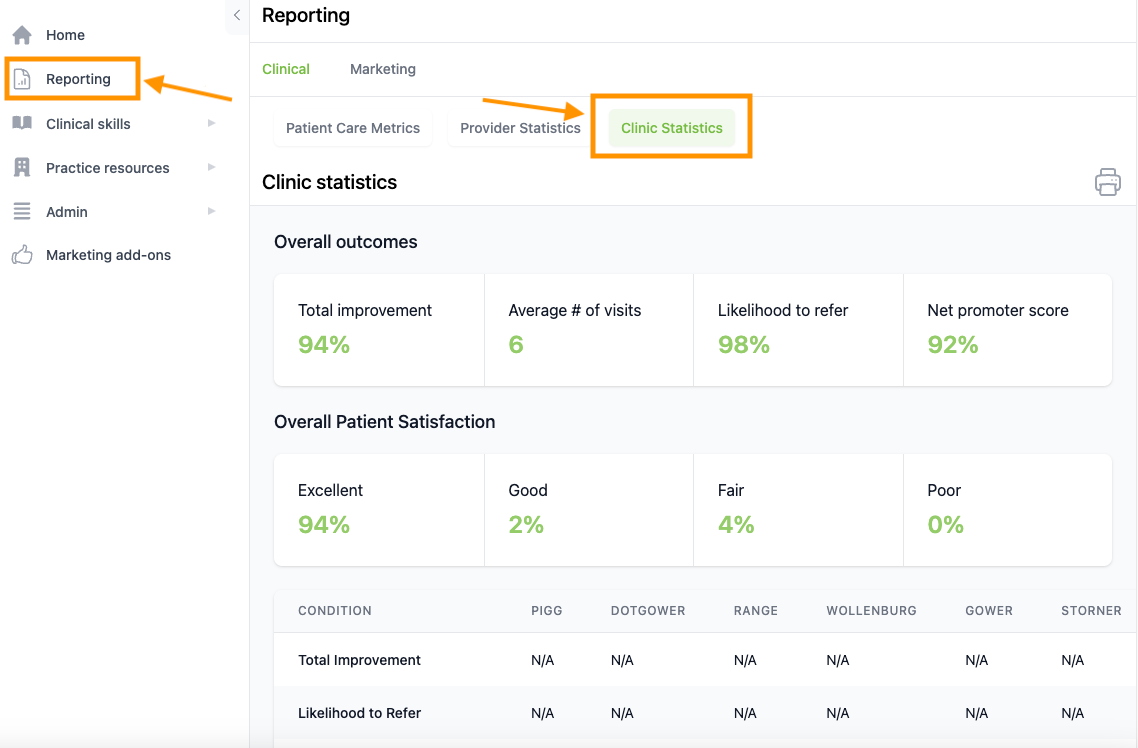
Clinic Statistics is a valuable tool for monitoring the overall performance of the entire clinic, including assessment of clinical outcomes and patient satisfaction. Clinic statistics are all derived from post-care survey responses.
Where can I access Clinic Statistics?
🔐 Only Admin users have permission to view the Clinic statistics.
To access Clinic Statistics, navigate to the Reporting tab located in the left-side panel. Select Clinic Statistics.
What stats are shown in Clinic Statistics?
The data located within Clinic Statistics derives from all thirty-day Post-Care Survey responses. Let's break down each section:
Overall Outcomes
- Total improvement: calculated from responses to question #1 on the post-care survey— “How much better do you feel as compared to initially?”
- Average # of visits: calculated from responses to question #2 on the post-care survey— "How many treatments have you received?"
- Likelihood to refer: calculated from responses to question #4 on the post-care survey— “How likely is it that you would recommend us to a friend or colleague?"
- Net promoter score (NPS): calculated from responses to question #4 on the post-care survey— “How likely is it that you would recommend us to a friend or colleague?"
- NPS is calculated by subtracting the percentage of detractors from the percentage of promoters. The resulting score can range from -100 to +100.
NPS = % Promoters - % Detractors
| Promoter | Neutral | Detractor |
| 9-10 | 7-8 | 0-6 |
Overall Patient Satisfaction
The overall patient satisfaction is calculated from responses to question #4 on the post-care survey— “How likely is it that you would recommend us to a friend or colleague?"
Condition Statistics Chart
The condition statistics chart offers a comprehensive breakdown of the treatment record for each condition in the ChiroUp library, categorized by provider, based on prescribed condition reports.
⚠️ The Outcome Tracker must be turned ON for the provider statistics to populate.
